Cat litter is a major daily product for cat owners. As new types of litter appear, people care more about quality. But lab tests do not always match what users feel at home. We wanted a lab method that fits real-life use. We bought six popular cat litters and tested clump strength in two ways: in a cat room (real use) and in the lab (simulated use). We found that at 80% air humidity, dripping 20 g of 0.9% salt water into the litter over 20 seconds, waiting 1 minute, then shaking the clump on a vibrating sieve for 8 seconds at 1,440 r/min, gives results that best match real use.
Introduction
In recent years, the pet industry in China has grown quickly. As people’s incomes and spending power rise, the “pet economy” keeps expanding. Among pet products, cat litter is one of the most important daily necessities for cat owners. Cat litter usually needs to absorb water well, clump tightly, and control odors. The earliest cat litter was made from yellow clay, which had poor water absorption and caused dust, making it less safe for both people and pets. Because of this, better alternatives were developed.
At first, cat litter was mainly used to absorb water and control smell. But now, pet owners want litter that is more convenient, safer, and environmentally friendly. To meet these demands, companies have created many types of cat litter. Still, the quality of products on the market is not always the same, and some do not fully meet the needs of consumers. Since pet litter is closely linked to health, product safety, and environmental protection, scientific testing is very important. Only with careful testing can the industry develop in a healthy way.
This study mainly looks at clumping ability, odor control, and dust levels—three key factors for judging cat litter. By testing these aspects, we can understand differences between products and improve overall quality. At the same time, the study aims to build a more unified evaluation system for cat litter in China. This will provide a clearer standard for the market and guide companies in product development.
Experimental Materials and Methods
1.1 Source and Sampling of Cat Litter
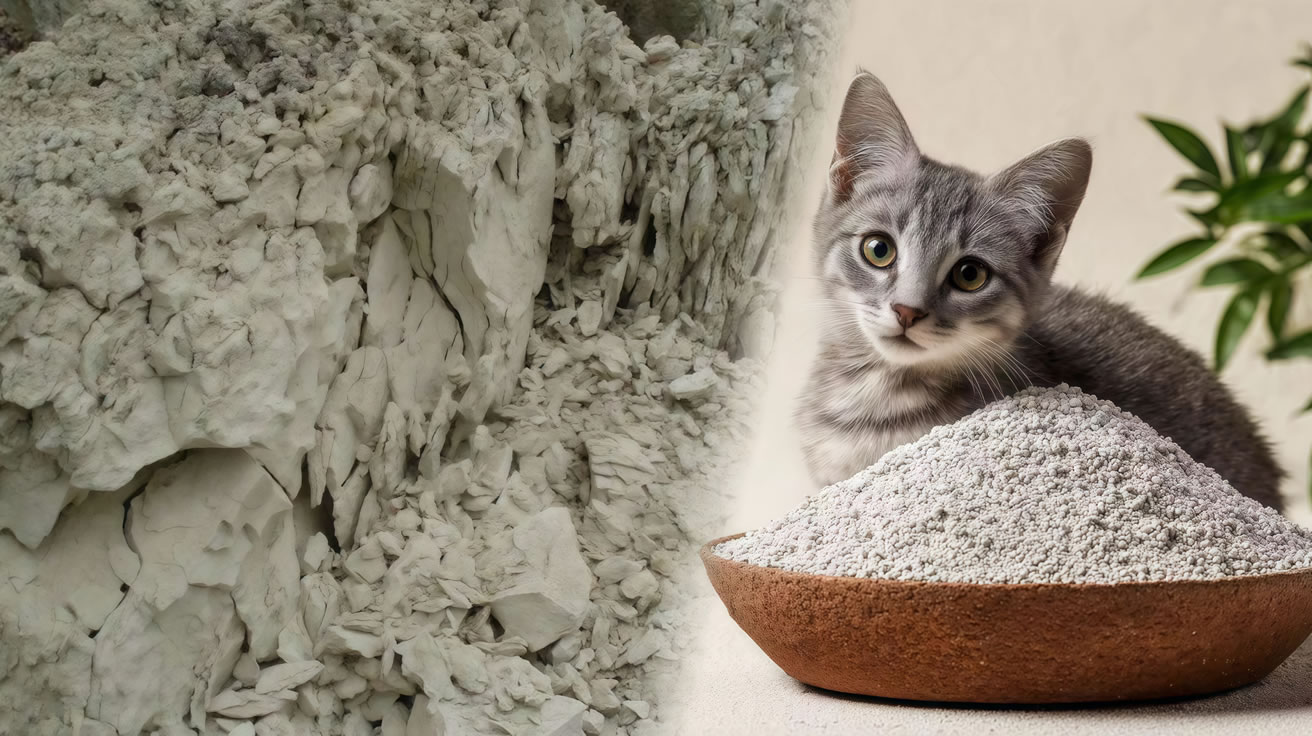
For this experiment, six different types of cat litter were collected. These included bentonite litter, tofu-based litter, pine wood litter, crystal silica gel litter, mixed mineral litter, and paper-based litter. Each type was purchased from the market and divided into samples for testing.
Table: Types of Cat Litter Used in the Study
| Type of Litter | Main Material/Features |
|---|---|
| Bentonite litter | Natural clay, strong clumping, common on the market |
| Tofu litter | Plant-based, biodegradable, flushable |
| Pine wood litter | Made from wood, natural odor control |
| Crystal litter | Silica gel, strong absorption, low tracking |
| Mixed mineral | Combination of minerals, balanced performance |
| Paper litter | Recycled paper, lightweight, eco-friendly |
1.2 Test Chemicals
0.9% saline solution.
1.3 Experimental Instruments
Constant temperature and humidity chamber (Tianjin Testwell Experimental Analysis Instrument Factory).
Shaker (Henan Jintai Mechanical Equipment Co., Ltd.).
Balance (Shanghai Hengping Scientific Instrument Co., Ltd., accuracy 0.01 g).
Electronic scale (Shanghai Balance Instrument Factory Co., Ltd.).
Vernier caliper (accuracy 0.01 mm).
Dissection tools.
Stopwatch (Shanghai Diamond Stopwatch Factory Co., Ltd.).
Microscope.
Milli-gram balance.
1.4 Experimental Animals
36 healthy domestic cats were selected. They came from local markets and included breeds such as British Shorthair, American Shorthair, Chinese Domestic Cats, Siamese Cats, and Ragdolls.
Age range: 1–5 years.
Gender ratio: equal number of males and females.
Health status: all clinically healthy.
Table 2: Experimental Animal Information
| Breed | Number of Cats | Age (years) | Weight (kg) | Gender |
|---|---|---|---|---|
| British Shorthair | 5 | 2–4 | 3.2–4.2 | Male/Female |
| American Shorthair | 5 | 2–3 | 3.4–4.2 | Male/Female |
| Chinese Domestic | 7 | 1–5 | 3.1–4.5 | Male/Female |
| Siamese | 7 | 1–5 | 3.2–4.1 | Male/Female |
| Ragdoll | 6 | 2–4 | 3.4–4.3 | Male/Female |
| Other Mixed Breeds | 6 | 1–4 | 3.2–4.0 | Male/Female |
1.5 Experimental Methods
Observation and Evaluation
Cats were placed in an animal observation room at the Pet Research Center.
They were raised in single cages with constant temperature, humidity, and ventilation.
Staff monitored their health daily.
Each type of cat litter was tested with 6 cats in three repeated trials.
Testing Cat Litter Performance
Cats were provided with the assigned type of cat litter in a clean litter box.
Observers recorded:
Clumping ability: how well the litter clumps after urination.
Odor control: how well it prevents bad smells.
Dust levels: how much dust is generated when cats dig or use the box.
Ratings were made on a scale of 1–5 (1 = very poor, 5 = excellent).
Each test lasted 7 days.
Scoring System
Each litter type was tested by 10 staff members.
Results were averaged to reduce personal bias.
Final scores reflected the combined evaluation of clumping, odor, and dust control.
Table 3: Evaluation Criteria
| Score | Performance Description |
|---|---|
| 1 | Very poor |
| 2 | Poor |
| 3 | Average |
| 4 | Good |
| 5 | Excellent |
2) Laboratory Test Methods
Cat Litter Moisture Content Test
Following GB 5009.3–2016 National Food Safety Standard for Determination of Moisture in Food, 5 g of cat litter was weighed and placed in a drying oven at 105°C until the weight no longer changed.
A precision balance (accuracy 0.001 g) was used to record weight.
The percentage of moisture was calculated by the difference between wet and dry weight.
Cat Litter Absorption Test
20 g of litter was measured, then placed in a beaker with 200 ml of water.
After 16 hours, the amount of water absorbed was calculated.
Water absorption rates were measured under three conditions: 30%, 50%, and 100% saturation.
The absorption efficiency (Q) was calculated as:
Q = (m₁/m) × 100%.
Where:
m₀ = initial weight of litter
m₁ = weight of litter after absorption.
Results and Discussion
2.1 Cat Trial Results
In the cat experiments, Samples 2 and 6 performed the best overall.
They had strong clumping, little dust, and excellent odor control.
Sample 3 also clumped well but produced more dust.
Sample 5 had good odor control but weaker clumping.
Sample 4 had poor performance in most areas.
Table 4: Cat Test Evaluation Results
| Sample | Clumping Ability | Odor Control | Dust Levels | Average Score |
|---|---|---|---|---|
| 1 | 4 | 3 | 4 | 4 |
| 2 | 5 | 5 | 5 | 5 |
| 3 | 5 | 3 | 4 | 4 |
| 4 | 2 | 2 | 2 | 2 |
| 5 | 4 | 5 | 3 | 4 |
| 6 | 5 | 5 | 5 | 5 |
2.2 Laboratory Test Results
1. Moisture Content
Based on GB 5009.3–2016, the six cat litter samples showed moisture contents ranging between 5.44%–7.81%.
Under 30%, 50%, and 100% water conditions, absorption rates varied between 6.54%–7.81% (30%), 7.12%–8.06% (50%), and 8.88%–14.01% (100%).
This means that different cat litters absorbed different amounts of water depending on saturation level, but all were within the expected range.
At 100% humidity, the moisture content of the six cat litters ranged from 13.15% to 21.34%.
Under natural conditions, their moisture content ranged from 7.24% to 9.59%.
Detailed data is shown in Table 5.
Table 5: Cat Litter Moisture Content under Different Humidity Conditions (%)
| Product | Natural Condition | Humidity 30% | Humidity 50% | Humidity 80% | Humidity 100% |
|---|---|---|---|---|---|
| Sample 1 | 9.02 | 6.56 | 7.81 | 17.21 | 21.34 |
| Sample 2 | 7.29 | 6.43 | 7.03 | 12.89 | 13.15 |
| Sample 3 | 8.72 | 6.51 | 8.78 | 17.03 | 20.11 |
| Sample 4 | 7.60 | 5.40 | 6.32 | 12.41 | 14.00 |
| Sample 5 | 9.47 | 7.02 | 8.43 | 18.05 | 20.05 |
| Sample 6 | 7.24 | 6.39 | 7.54 | 14.10 | 20.05 |
From Table 5 we can see:
Under natural conditions, the moisture content of cat litter was mostly between 50% and 80% humidity.
Sample 1 had the highest water absorption, with a moisture content of 21.34% at 100% humidity.
Sample 2 had the weakest absorption, with only 13.15% at 100% humidity.
2) Cat Litter Clumping Strength Test Results
The clumping strength test was done by shaking the litter under natural conditions.
After 4 seconds of shaking, the clumping strength of the six samples ranged from 93.12% to 97.50%.
After 5 seconds, it ranged from 89.94% to 96.44%.
After 6 seconds, it ranged from 88.90% to 96.27%.
After 7 seconds, it ranged from 91.20% to 96.50%.
After 8 seconds, it ranged from 92.28% to 97.12%.
After 9 seconds, it ranged from 93.26% to 98.38%.
In general, clumping strength showed a slight decline first, then improved again.
Detailed data is shown in Table 6.
Table 6: Clumping Strength of Cat Litter under Natural Conditions (%)
| Product | 4 s | 5 s | 6 s | 7 s | 8 s | 9 s |
|---|---|---|---|---|---|---|
| Sample 1 | 94.52 | 94.50 | 94.56 | 95.24 | 95.79 | 97.87 |
| Sample 2 | 93.42 | 93.27 | 92.98 | 94.12 | 96.12 | 97.12 |
| Sample 3 | 97.50 | 96.44 | 96.27 | 96.50 | 96.78 | 98.38 |
| Sample 4 | 93.12 | 89.94 | 88.90 | 91.20 | 92.28 | 93.26 |
| Sample 5 | 96.73 | 95.61 | 95.28 | 96.01 | 96.40 | 97.21 |
| Sample 6 | 95.08 | 94.20 | 94.01 | 94.87 | 95.89 | 96.83 |
At 30% humidity, the clumping strength of the six types of cat litter was tested under different shaking times:
4 seconds: strength ranged from 86.82% to 98.15%.
5 seconds: strength ranged from 84.44% to 98.47%.
6 seconds: strength ranged from 92.5% to 97.28%.
7 seconds: strength ranged from 88.36% to 98.52%.
8 seconds: strength ranged from 86.09% to 99.17%.
9 seconds: strength ranged from 90.57% to 99.87%.
At 30% humidity, although the shaking times were the same, the differences in clumping strength between the six cat litters were relatively large.
Detailed data is shown in Table 7.
Table 7: Clumping Strength Results under 30% Humidity (%)
| Product | 4 s | 5 s | 6 s | 7 s | 8 s | 9 s |
|---|---|---|---|---|---|---|
| Sample 1 | 94.95 | 96.72 | 95.64 | 96.21 | 98.38 | 99.17 |
| Sample 2 | 86.82 | 84.4 | 95.28 | 88.36 | 89.72 | 90.57 |
| Sample 3 | 98.15 | 98.47 | 97.28 | 98.52 | 98.83 | 99.87 |
| Sample 4 | 92.5 | 95.01 | 97.24 | 97.08 | 97.62 | 98.36 |
| Sample 5 | 97.32 | 97.26 | 95.88 | 96.94 | 97.58 | 98.27 |
| Sample 6 | 93.85 | 96.4 | 96.51 | 97.24 | 97.25 | 98.15 |
At 50% humidity, the clumping strength of the six cat litters was as follows:
4 seconds: strength ranged from 91.06% to 95.71%.
5 seconds: strength ranged from 89.06% to 98.41%.
6 seconds: strength ranged from 88.18% to 96.89%.
7 seconds: strength ranged from 91.09% to 98.12%.
8 seconds: strength ranged from 90.64% to 98.47%.
9 seconds: strength ranged from 96.14% to 99.38%.
At 50% humidity, when shaking lasted 5–6 seconds, the differences between samples became more noticeable.
The difference in clump strength between the litters was quite large. For detailed data, see Table 8
Table 8: Clumping Strength Results under 50% Humidity (%)
| Product | 4 s | 5 s | 6 s | 7 s | 8 s | 9 s |
|---|---|---|---|---|---|---|
| Sample 1 | 95.7 | 94.78 | 94.68 | 95.83 | 96.84 | 98.38 |
| Sample 2 | 91.46 | 93.5 | 93.25 | 94.27 | 96.08 | 97.26 |
| Sample 3 | 92.44 | 93.81 | 94.52 | 95.10 | 97.25 | 98.33 |
| Sample 4 | 91.03 | 92.79 | 94.63 | 95.52 | 96.72 | 98.27 |
| Sample 5 | 93.86 | 95.14 | 95.84 | 96.32 | 97.24 | 98.14 |
| Sample 6 | 94.6 | 95.92 | 96.13 | 96.92 | 97.53 | 99.38 |
At 80% humidity, the clumping strength test results for the six cat litters were:
4 seconds: strength ranged from 94.25% to 98.75%.
5 seconds: strength ranged from 93.7% to 99%.
6 seconds: strength ranged from 93.8% to 99.2%.
7 seconds: strength ranged from 95.15% to 98.9%.
8 seconds: strength ranged from 96.1% to 99.2%.
9 seconds: strength ranged from 94.74% to 99.68%.
At 80% humidity, during shaking times of 4.5–6 seconds, the clumping strength values of the six litters were very close to each other, showing little difference.
Detailed results are provided in Table 9.
Table 9: Clumping Strength Results under 80% Humidity (%)
| Product | 4 s | 5 s | 6 s | 7 s | 8 s | 9 s |
|---|---|---|---|---|---|---|
| Sample 1 | 98.75 | 98.3 | 98.2 | 97.45 | 97.25 | 96.7 |
| Sample 2 | 97.67 | 97.35 | 97.65 | 97.5 | 97.25 | 97.47 |
| Sample 3 | 98.3 | 97.5 | 98.57 | 98.25 | 97.94 | 97.29 |
| Sample 4 | 98.5 | 99.0 | 98.25 | 98.0 | 97.5 | 96.6 |
| Sample 5 | 98.3 | 99.0 | 99.25 | 98.7 | 98.0 | 97.5 |
| Sample 6 | 95.5 | 95.5 | 98.9 | 95.25 | 92.25 | 94.74 |
At 100% humidity, clumping strength of the six cat litters was:
4 seconds: 0%–97.3%
5 seconds: 0%–96.39%
6 seconds: 0%–98.57%
7s econds: 0%–97.74%
8 seconds: 0%–97.67%
9 seconds: 0%–98.87%
At 100% humidity, one type of litter did not clump at all.
Details are shown in Table 10.
Table 10: Clumping Strength Results under 100% Humidity (%)
| Product | 4 s | 5 s | 6 s | 7 s | 8 s | 9 s |
|---|---|---|---|---|---|---|
| Sample 1 | 95.27 | 93.7 | 92.67 | 91.54 | 91.25 | 0 |
| Sample 2 | 88.86 | 71.58 | 78.48 | 47.07 | 0 | 0 |
| Sample 3 | 91.12 | 75.0 | 78.89 | 52.41 | 0 | 0 |
| Sample 4 | 93.19 | 93.39 | 93.67 | 91.52 | 88.88 | 88.42 |
| Sample 5 | 94.85 | 93.93 | 95.25 | 92.14 | 88.88 | 88.44 |
| Sample 6 | 0 | 0 | 0 | 0 | 0 | 0 |
From the results of Tables 4–10, it can be confirmed that the best testing condition for cat litter clumping strength is at 80% humidity with 8 hours of shaking, because this is closest to the way cats use litter in real life.
Results Analysis and Discussion
This study tested cat litter under five different humidity conditions to better match the air humidity of real-life use. During testing, both cat litter moisture content and clumping strength were measured.
At 30% humidity, litter moisture was lowest, but clumping strength was not the highest.
At 100% humidity, one type of cat litter did not clump at all, while others showed weak clumping. This was likely because the litter absorbed too much water, destroying the clumping structure.
The best clumping results were found between 50% and 80% humidity, which is also close to real-life conditions.
Cats typically use litter boxes for about 7 hours each day, so moisture content at this range (50–80%) is the most practical.
To make the test results even closer to real-life use, shaking times were set between 4–9 hours. Results showed:
At first, clumping strength decreased with time.
After 10 hours, clumps started to break down.
For example: after 6 hours, clumping strength was 92.16%, while after 10 hours it dropped to 85.79%.
This suggests that cats usually complete their litter use within this time range (4–9 hours).
In addition, this experiment used 0.9% saline solution instead of plain water, to better simulate the salt content of cat urine. The test was done at 38 ± 2°C, which is closer to real living conditions.
Final Thoughts
From the test results of cat litter clumping strength in both real-life use and laboratory conditions, it was found that under 80% humidity, with an 8-second vibration time and a vibration frequency of 1440/min, the clumping strength measured is closest to the real experience of users. Since cat litter is used in many different environments, the results from laboratory tests only approximate real-life results, and cannot be considered fully consistent.
This test was done in northern areas, and during a season without much rain. In places with high humidity or in rainy seasons, more research is still needed.
Cat litter companies can use this kind of test as a quality check. Besides following the current industry standards, they can also add tests that better reflect real-life user situations, which would improve customer satisfaction.
This study helps to build a testing method that is closer to actual user experience, and it provides a direction for improving and updating cat litter standards